Analytics
Key Benefits
- Gain real-time visibility into performance data across all business functions – from summary to transactional level
- Track plant floor performance to identify inefficiencies and take decisions
- Get personalized experience, with intuitive reporting tools without requiring programming or technical resources
- Improve ability to respond to changing business conditions
- Access your dashboards while on the move using mobile devices
- Identify and analyze opportunities and trends
Key Features
Dashboards
Get a single source of consistent and quality data, tailored for each department and role with intuitive dashboards for each ERP function. Be on top of individual/department operations and improve their efficiency and productivity.
Department Summary
Provides an overall summary of the latest happenings on the manufacturing shop floor.
With intuitive charts and graphs, shop supervisors can track parts created, total man-hours spent, work orders created, attendance & work hours, scrap generated, etc. They can measure efficiency for each manufacturing process as well as for the overall department.
Labor Efficiency
Quotes vs. Orders
Projects
The project management dashboard offers interesting insights to the projects team. Project managers can track task completion of each project with task completion console.
They can track purchases by item category, and vendor. The project tasks dashboard displays the complete list of tasks along with the start & due date, %age of completion, estimated timeline, and color-coded status.
Quotations and Sales
The sales and quotations dashboard provides a comprehensive overview of quotations created and their conversion to sales till date. The sales team can view customer-wise quotations that are created, invoiced, lost, and their conversion to sales.
They can view quotations by state, item, territory, country, and customers. Sales managers can filter leads by sales reps and their respective targets too.
Inventory
Inventory managers can use the inventory usage dashboard to monitor inventory consumption and take adequate measures to prevent low inventory levels.
They can analyze inventory usage patterns by item number and type. They can filter the data by year, month, item type, category, subcategory, item number, and warehouse.
The inventory value dashboard also displays top inventory items based on the highest inventory values.
Planning
The planning team can use the MRP dispatch list summary to check department-wise dispatches made on a particular date or month along with backlog details. Capacity planning is improved as personnel gets to view overall capacity utilization and efficiency in the form of worked hours vs. scheduled hours.
The material planning team can view the top 10 items that are in shortage for the past 7 days. They can compare materials allocated vs. materials that are in shortage along with item-wise breakup. They also get a breakup of total shortage quantity by items, procurement type, and vendor.
Financials
Mobile Device Accessibility
Easy Development And Enhancements
Enhance any of the standard reports and dashboards with minimum technical knowledge.
You can create new reports and dashboards using easy-to-use SQL development tools. Data visualizations can be developed using simple configuration tools.
Our Customers are Our Purpose and Our Strength

People expect that an ERP system will allow them to run their business exactly how they want to, but more often than not, the ERP system is the glove and you’re the hand that has to squeeze into it.
Not so with OmegaCube. They helped us meet our vision rather than requiring us to formulate our processes around their solution.

There were competitors who weren’t as flexible as OmegaCube. OmegaCube assured us that they can do whatever we want them to do and they can adjust to fit our organization and not the other way around. They provided us insights into what they did for other customers and we saw what work they have done for them. This was, eventually, the final selling point for us.”

This was March 2020 and then COVID-19 hit. If we were still using the old FoxPro system and the manual way of operating, I don’t think we could have had everybody go home and work remotely.
With OmegaCube ERP, we were able to work remotely and still operate during the pandemic. Even though we just completed setting up our initial ERP system, our employees were able to run with it while working remotely and that ended up working out great. The system operated efficiently for sales, engineering, and purchasing.
I don’t think we could have done that with the old FoxPro system as we did with OmegaCube ERP. So the timing of implementing OmegaCube ERP was perfect.
Browse through our Latest ERP and Technological Insights

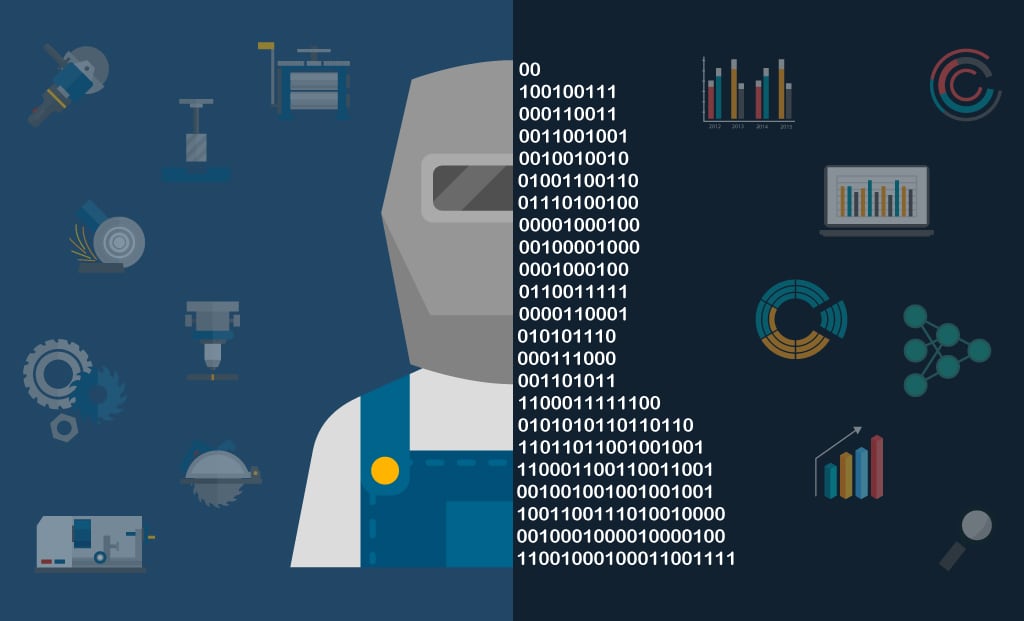
How Advanced Analytics and Business Intelligence Dashboards boost Enterprise’s Efficiency?
FAQ
Shop Floor Management in OmegaCube ERP helps manufacturers to get real-time view of their shop floor operations, track & improve resource utilization, improve yield quality, meet compliance standards, reduce machine breakdown/idle time and improve overall efficiency.
Equipment Maintenance in OmegaCube ERP helps maintain accurate financial statements and reports such as, Balance Sheet, Income Statement, Cash Flow, and Ageing etc. with real-time data updates. Advanced financial dashboard and analytics suite helps manufacturers to take smart and timely business decisions.
OmegaCube ERP’s Mobile Application solutions give manufacturers the much-required mobility and the power to access ERP data on the move. They can access transactions, reports, dashboards, alerts from any hand-held device, anywhere. They can also create new applications or add more functionalities to suit their requirement.

